Back to article: Attenuating MKRN1 E3 ligase-mediated AMPKα suppression increases tolerance against metabolic stresses in mice
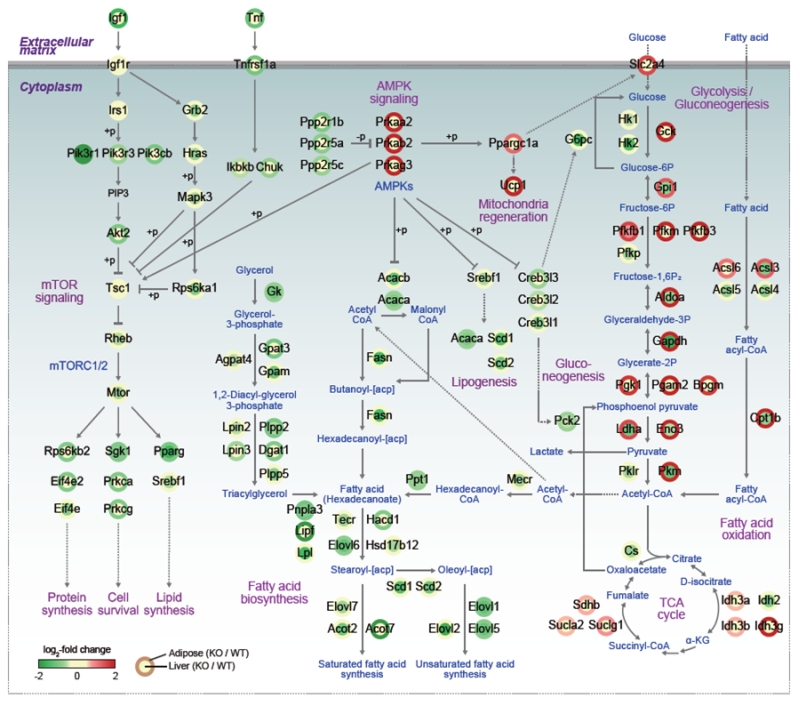
FIGURE 1: Regulation of Metabolism in MKRN1 knockout mice. Network models describing alterations of cellular processes regulated by DEGs in MKRN1-null liver and adipose tissue. Solid lines denote metabolic reactions and dotted lines denote transports of molecules or transcriptional regulations between transcriptional regulators and their target genes. Node center and border colors represent up- (red) or down-regulation (green) in MKRN1-null liver (center) and adipose tissue (border; see the legend for node center and border). The color bar represents the gradient of log2-fold-changes of mRNA expression levels by MKRN1 ablation relative to those in WT. Plasma membranes were denoted by thick gray lines, cytoplasm by blue background, and extracellular matrix by white background.

