Back to article: MiR-200c reprograms fibroblasts to recapitulate the phenotype of CAFs in breast cancer progression
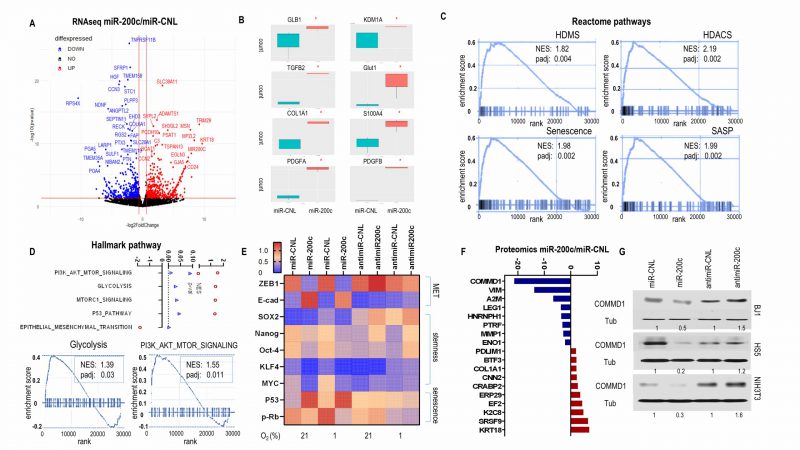
FIGURE 3: Effects of fibroblast miR-200c on MET, senescence and CAF phenotype. (A-D) RNAseq data for BJ1miR-200c versus control. (A) Volcano plot showed the most differentially expressed genes. (B) Boxplots for the relevant markers expression of senescence, HDMs, cytokine, glycolysis and growth factors. (C) GSEA plot enrichment of Reactome pathways driven by miR200c (D) GSEA of Hallmark pathways driven by miR200c. (E) Protein levels of BJ1 cells overexpressing or inhibiting miR-200c and control under normoxic and hypoxic conditions. (F) Barplot from proteomic assay showing genes with fold change >2 between BJ1miR-200c and control. (G) COMMD1 level in fibroblasts with miR-200c overexpression or inhibition.