Back to article: MiR-200c reprograms fibroblasts to recapitulate the phenotype of CAFs in breast cancer progression
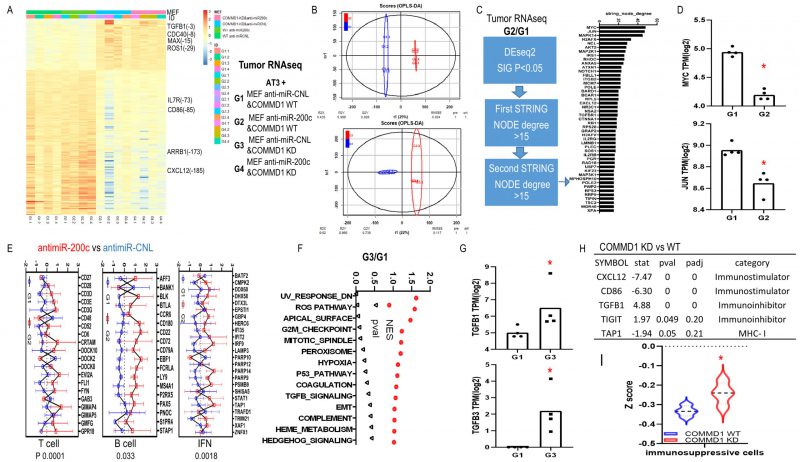
FIGURE 9: Transcriptional effect of anti-miR-200c and COMMD1 KD in fibroblasts on tumor growth in vivo. (A-H) RNAseq data for mice tumors of co-injection with AT3 and MEF anti-miR-200c/COMMD1 KD versus control. (A) Heatmap showed differentially expressed genes in four groups. (B) OPLS-DA of G2 versus G1 and G3 versus G1. (C) G2 versus G1. Schematic and barplot showed the differentially expressed genes regarding highly connected networks. (D) Fold change of MYC and JUN in G2 versus G1. (E) Plot for immune assay of antimiR-200c vs control group. (F) GSEA hallmark pathways in G3 versus G1. (G) Fold change of TGFB1, TGFB3 expression in G3 versus G1. (H)Gene alteration related to check point effect in COMMD1 KD vs WT group. (I) Immunophenoscore analysis comparing immunosuppressive cells in COMMD1 KD vs WT group.