Back to article: Targeting the TGFβ pathway in uterine carcinosarcoma
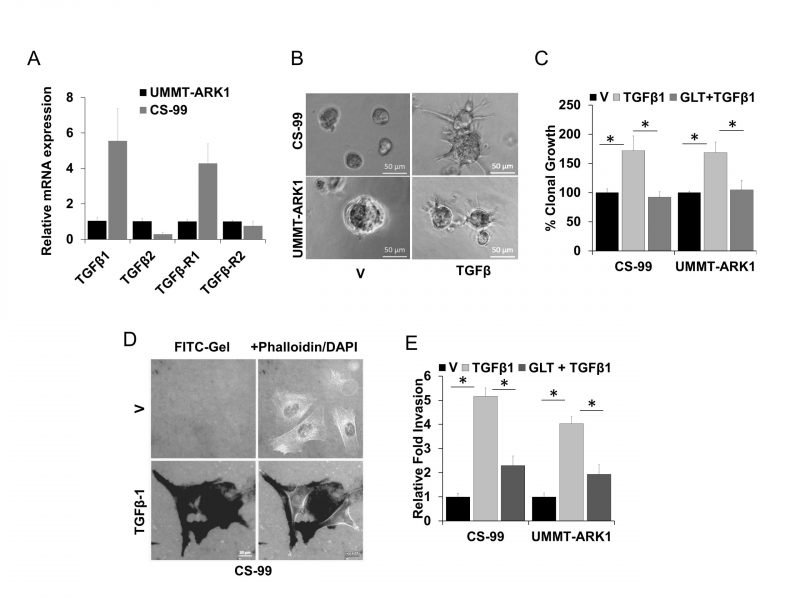
FIGURE 1: Role of TGFβ1 in mediating an aggressive UCS phenotype.(A) Relative mRNA expression of TGFβ1, TGFβ2, TGFβR1, and TGFβR2 in UMMT-ARK1 and CS-99 cells. Data are mean ± SE. (B) 1×10⁴ UMMT-ARK1 and CS-99 cells were grown in 3D culture, once the colonies were visible they were treated as indicated for 48 h and imaged. Representative images are shown. (C) 1×10⁴ UMMT-ARK1 and CS-99 cells were plated in Matrigel, treated with either control vehicle (V), TGFβ1 (5 ng/ml), or GLT (5 µM) + TGFβ1. Colonies were imaged and quantitated using Optronix Gelcount colony counter, % clonal growth compared to vehicle treated control are shown. (D) Representative images of CS-99 cells plated on Oregon Green 488 Gelatin–coated coverslips and treated with 5 ng/ml TGFβ1 for 18 h. The cells were fixed and the cellular F-Actin was stained with Alexa Fluor 555 Phalloidin and mounted in VECTASHIELD mounting medium containing DAPI, the dark areas in the left panels represent FITC-gelatin degradation. (E) Relative fold invasion derived from evaluation of <100 cells as shown in (D). Error bars represent standard deviation. *, P<0.05 was considered significant.