Back to article: LTX-315 sequentially promotes lymphocyte-independent and lymphocyte-dependent antitumor effects
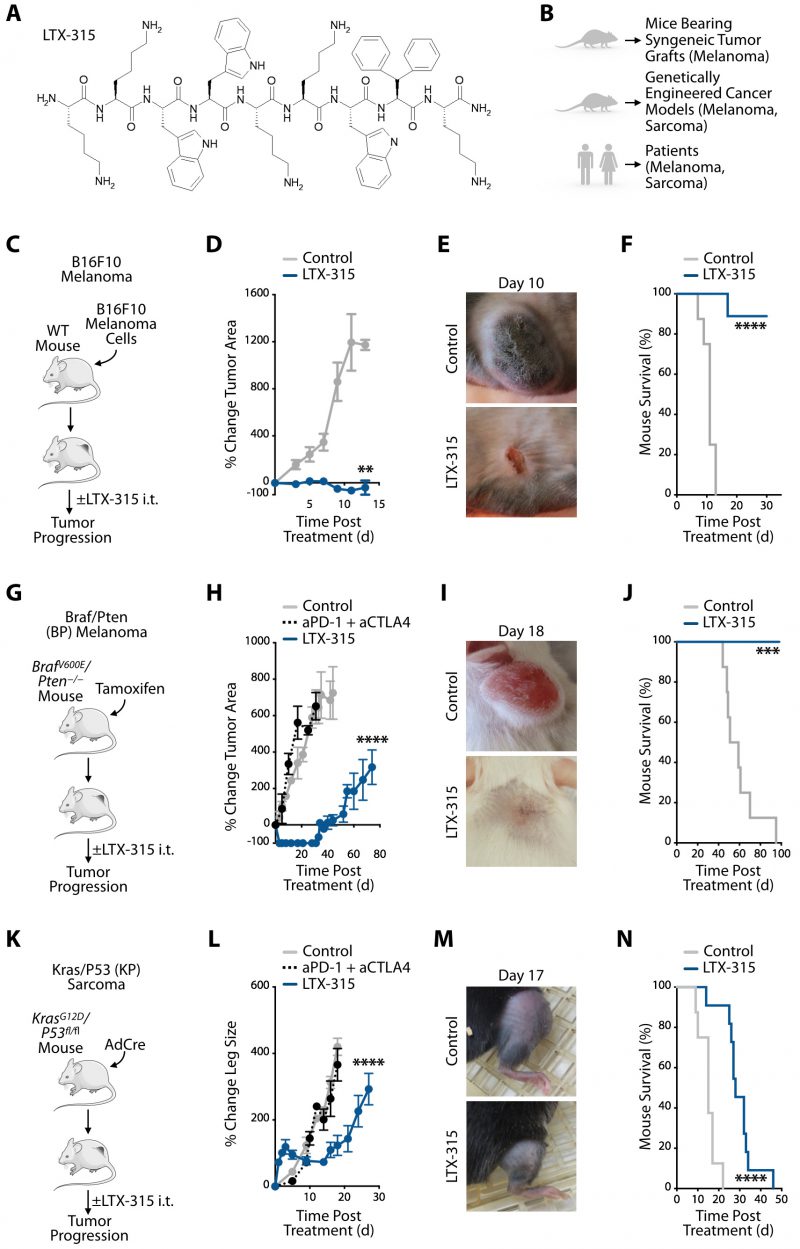
FIGURE 1: LTX-315 controls tumor growth and improves survival in conditional genetic melanoma and soft tissue sarcoma mouse models. (A) Chemical structure of oncolytic peptide LTX-315 (KKWWKKWDipK where Dip is β-diphenylalanine, which promotes stiffness and a rigid peptide structure). (B) Experimental approaches used to study LTX-315 effects in melanoma and sarcoma mouse models and in cancer patients. (C) Schematic of B16F10 melanoma experiments: C57BL/6 mice bearing B16F10 melanoma tumor grafts were either treated intratumorally (i.t.) with LTX-315 or left untreated. (D) Change in B16F10 tumor area of LTX-315-treated or control mice relative to pre-treatment baseline. n = 8 to 9 mice/group. (E) Representative images of B16F10 tumors either on day 10 after LTX-315 treatment or from untreated mice. (F) Kaplan-Meier survival analysis of B16F10 tumor-bearing mice treated with LTX-315 (blue) or left untreated (gray). n = 8 to 9 mice/group. (G) Schematic of BP melanoma experiments: BrafV600E/Pten−/− (BP) mice subjected to tamoxifen to produce tumors were either treated intratumorally (i.t.) with LTX-315 or left untreated. (H) Change in BP tumor area of LTX-315-treated or control mice relative to pre-treatment baseline. Additional mice received immune checkpoint blockade treatment with anti-PD1 and anti-CTLA-4 antibodies (aPD-1 + aCTLA4, black). n = 4 to 7 mice/group. (I) Representative images of BP tumors either on day 18 after LTX-315 treatment or from untreated mice. (J) Kaplan-Meier survival analysis of BP tumor-bearing mice treated with LTX-315 (blue) or left untreated (gray). n = 5 to 8 mice/group. (K) Schematic of KP soft tissue sarcoma experiments: KrasG12D/p53fl/fl (BP) mice subjected to intramuscular leg injection with Adenovirus expressing Cre recombinase (AdCre) to produce tumors were either treated intratumorally (i.t.) with LTX-315 or left untreated. (L) Change in leg size of LTX-315-treated or untreated KP mice relative to pre-treatment leg size. Additional mice received immune checkpoint blockade treatment (aPD-1 + aCTLA4, black) intraperitoneally. n = 5 to 8 mice/group. (M) Representative images of KP tumors either on day 17 after LTX-315 treatment or from untreated mice. (N) Kaplan-Meier survival analysis of KP tumor-bearing mice treated with LTX-315 (blue) or left untreated (gray). n = 8 to 11 mice/group. Results are expressed as mean ± SEM. **p < 0.01; ***p < 0.001; ****p < 0.0001. Abbreviations are as follows: d = day.