Back to article: HIF1α-dependent mitophagy facilitates cardiomyoblast differentiation
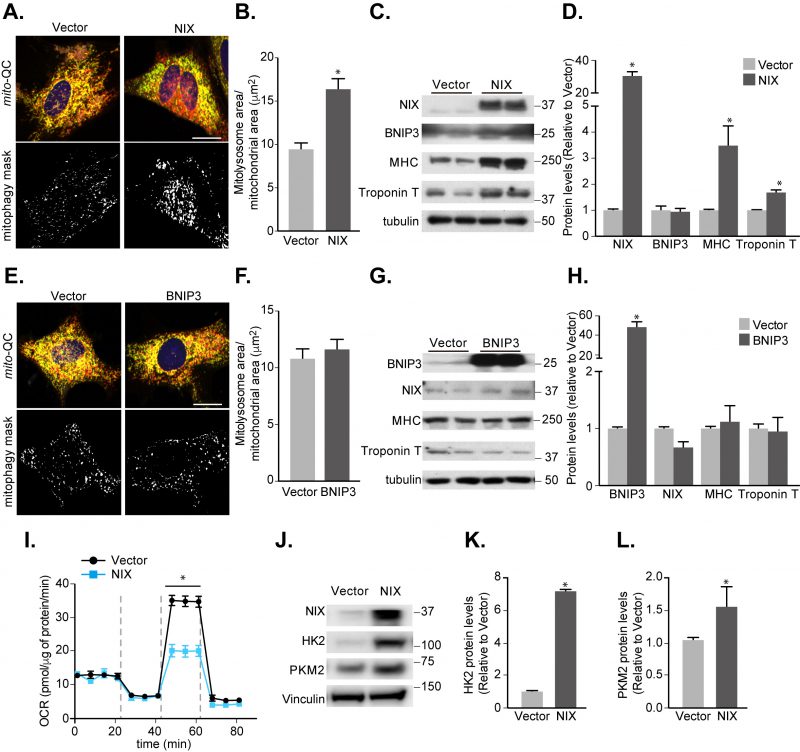
FIGURE 7: Increasing NIX-dependent mitophagy promotes cardiomyocyte differentiation. (A) Representative images from mito-QC H9c2 vector control cells or cells overexpressing NIX cultured following 7 days differentiation. Mitophagy mask represented as the mCherry/GFP ratio intensity above the mean of mCherry intensity. (B) Quantitation from (A) of total mitolysosome area per mitochondrial content as indicated. (C) Representative immunoblot of NIX, BNIP3, MHC and cardiac Troponin T protein levels from 7 days differentiated H9c2 cells stably overexpressing NIX. (D) Quantitation of data from (C). (E) Representative images from mito-QC H9c2 cells overexpressing vector or BNIP3 cultured in differentiation medium for 7 days. (F) Quantitation from (E) of total mitolysosome area per mitochondrial content as indicated. (G) Representative immunoblot of NIX, BNIP3, MHC and cardiac Troponin T protein levels from 7 days differentiated H9c2 cells stably overexpressing BNIP3. (H) Quantitation of data from (G). (I) Oxygen consumption rate (OCR) was measured after H9c2 cells stably overexpressing vector or NIX following 7 days differentiation. (J) Immunoblot of HK2 and Pyruvate kinase (PKM2) from H9c2 cells stably overexpressing vector or NIX cultured in differentiation medium for 7 days. Quanitation of HK2 (K) and PKM2 (L) is shown. Scale bar, 20 μm. All quantitative data are mean ± SEM from 3 independent experiments. * P < 0.05.