Back to article: The evolution of the concept of stress and the framework of the stress system


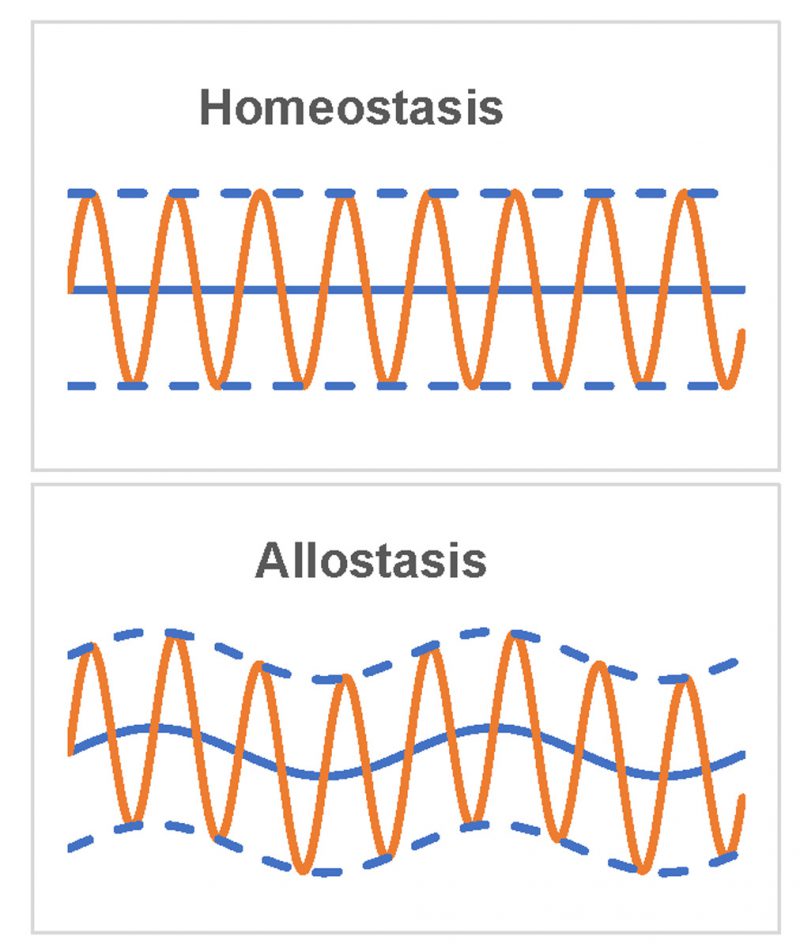
FIGURE 2: Homeostasis and allostasis. Blue solid line represents the baseline, orange line represents dynamic equilibrium, and blue dot line represents the boundary of dynamic equilibrium.

By continuing to use the site, you agree to the use of cookies. more information

The cookie settings on this website are set to "allow cookies" to give you the best browsing experience possible. If you continue to use this website without changing your cookie settings or you click "Accept" below then you are consenting to this. Please refer to our "privacy statement" and our "terms of use" for further information.

Close