Back to article: Evaluation of I-TAC as a potential early plasma marker to differentiate between critical and non-critical COVID-19
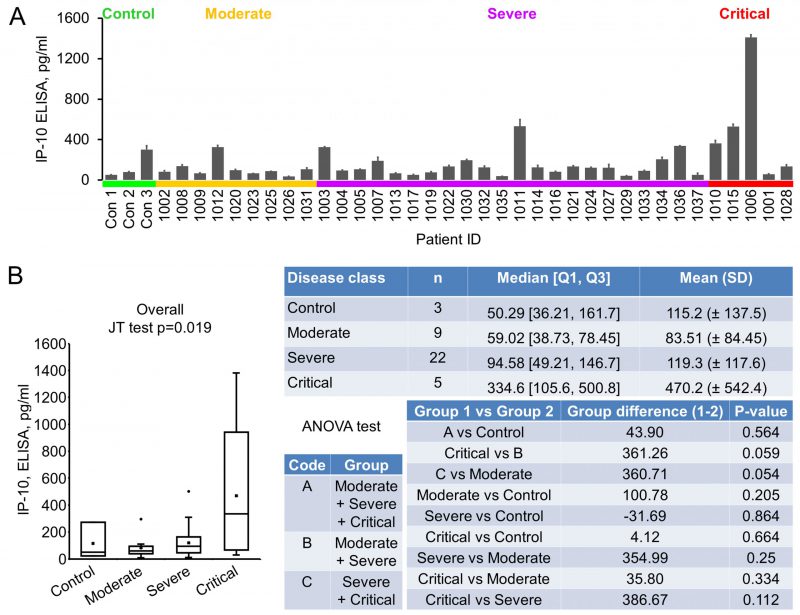
FIGURE 2: IP-10 levels in early plasma samples.(A) IP-10 levels were measured using ELISA kits. Plasma (10 µl) were diluted to 100 µl and added to anti-IP-10 antibody coated wells in duplicate. Data were groups by disease stage and expressed as mean ± SD. (B) Statistical analysis of IP-10 levels with disease stages.