Back to article: Evaluation of I-TAC as a potential early plasma marker to differentiate between critical and non-critical COVID-19
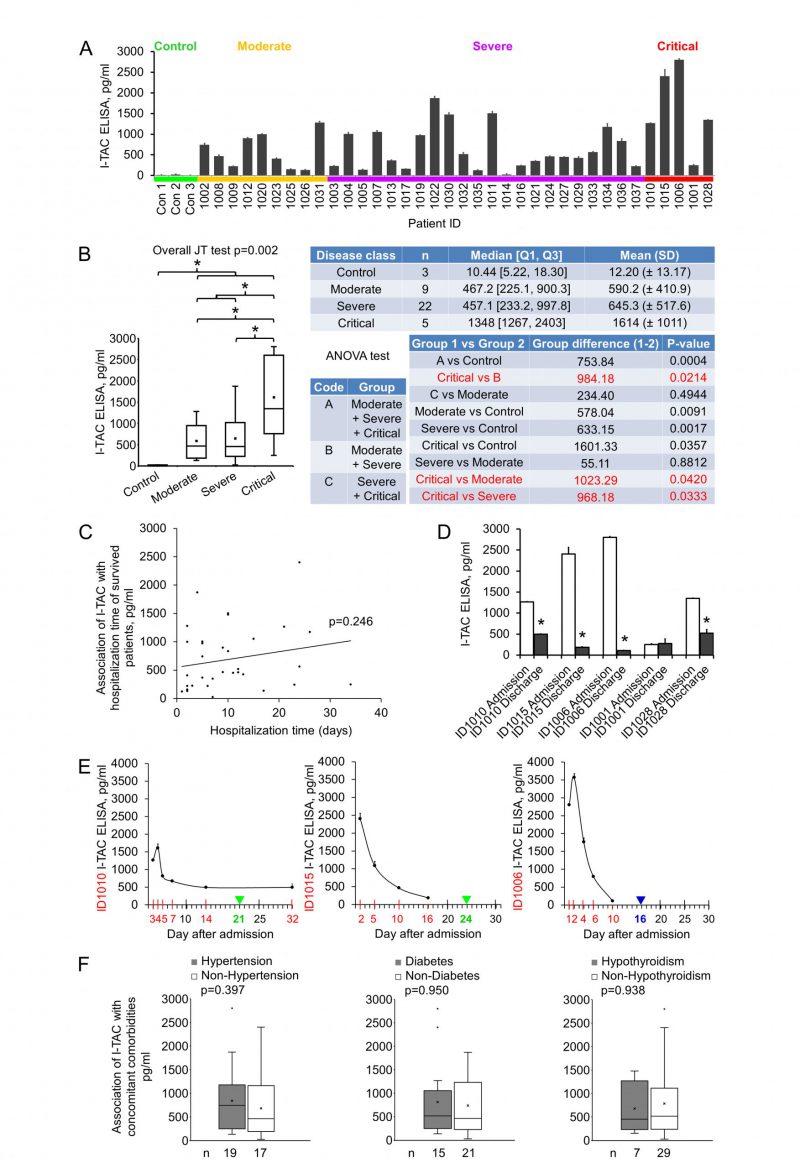
FIGURE 3: I-TAC levels in patient plasma.(A) I-TAC levels were measured using ELISA kits. Early plasma (25 µl) were diluted to 100 µl and added to anti-I-TAC mixture coated wells in duplicate. Data were groups by disease stage and expressed as mean ± SD. (B) Statistical analysis of I-TAC levels with disease stages. (C) Association of early plasma I-TAC levels with hospitalization time of survived patients (n=34). (D) I-TAC levels at time closest to discharge. ID1010: 7 days before discharge; ID1015: 8 days before discharge; ID1006: 6 days before discharge; ID1001: 2 days before discharge; ID1028: 7 days before discharge. Admission: within 3 days of hospitalization. (E) Changes of I-TAC level after admission. Red number day: sample collection time. Green number day and green triangle: discharged live. Blue number day and blue triangle: discharged deceased. (F) Association of early plasma I-TAC with concomitant comorbidities. Comorbidities and patient numbers in each group (n) were indicated. *, p<0.05.