Back to article: A versatile method for the identification of senolytic compounds
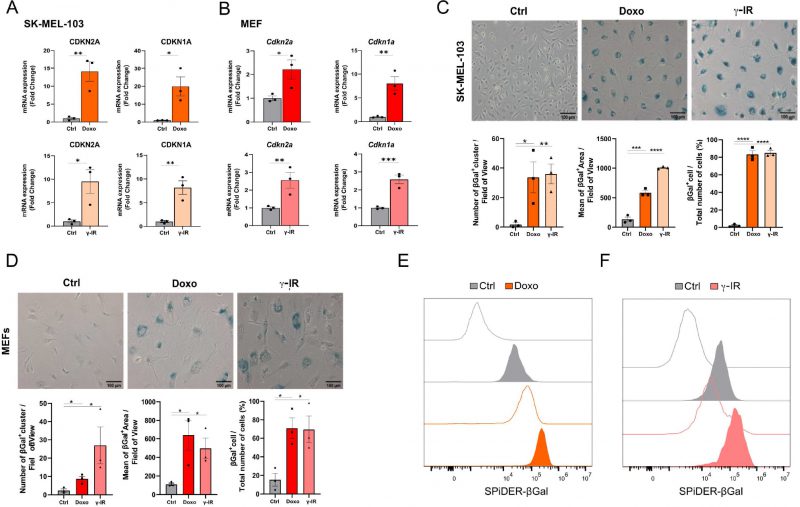
FIGURE 1: Cellular models of senescence. (A, B) mRNA expression levels of CDKN2A and CDKN1A in SK-MEL-103 (A) and MEF (B) cells untreated or treated with doxorubicin (Doxo) or irradiation (γ-IR). Data are represented as fold change to control (mean ± SEM; pooled from N=3 independent experiments; *p<0.05; **p<0.01; ***p<0.001, unpaired, two-tailed Student's t-test compared to Control). (C, D) Representative images and quantification of senescence-associated β-Gal staining of Control, Doxo-treated or γ-IR treated senescent SK-MEL-103 (C) and MEF (D) cells. Positivity to senescence-associated β-galactosidase is measured as number of ß-Gal positive cluster per field of view, mean of the positive area or percentage of β-Gal+ cells over total number of cells. Data are represented as mean ± SEM (pooled from N=3 independent experiments; *p<0.05; **p<0.01; ***p<0.001, ****p<0.0001 unpaired, two-tailed Student's t-test compared to Control). Scale Bar 100 μm. (E, F) Flow cytometry analysis of SPiDER-β-Gal fluorescence intensity detected in control or doxo and γ-IR treated senescent SK-MEL-103 (E) and MEF (F) cells. Transparent histograms indicate the unstained condition per each sample (one representative experiment is shown, N=2 independent experiments).