Back to article: A versatile method for the identification of senolytic compounds
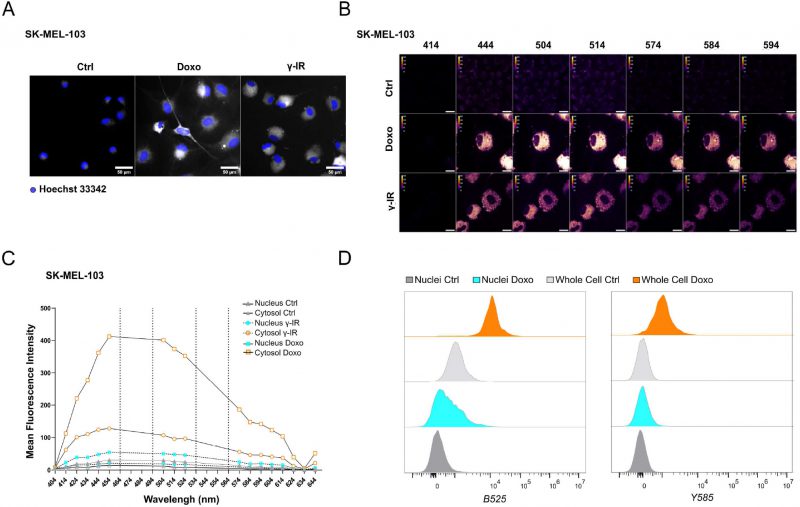
FIGURE 2: Spectral imaging-based profiling of senescent SK-MEL-103 cells. (A) Representative images of unlabeled SK-MEL-103 untreated or treated with doxo or γ-IR to induce senescence, acquired with a 488-excitation laser and an emission filter 525/50. Hoechst 33342 was used for nuclear counterstaining. Scale Bar: 50 μm. (B) Spectral Imaging analysis of senescent SK-MEL-103 cells, untreated or treated with doxo or γ-IR to induce senescence, after excitation at 405 nm. Representative images recorded at 414 nm, 444 nm, 504 nm, 514 nm, 574 nm, 584 nm, and 594 nm wavelengths are depicted. (C) Mean Fluorescence Intensity of the cytoplasmic and nuclear regions of interest of control and senescent SK-MEL-103 cells acquired at wavelengths comprised between 404 nm and 644 nm after excitation at 405 nm. (D) Comparative analysis of fluorescence intensity detected in whole control or senescent (doxo-treated) cells or isolated nuclei by flow cytometry. Fluorescence recorded after excitation with blue B525 (left) or yellow Y585 (right) lasers is shown.