Back to article: A versatile method for the identification of senolytic compounds
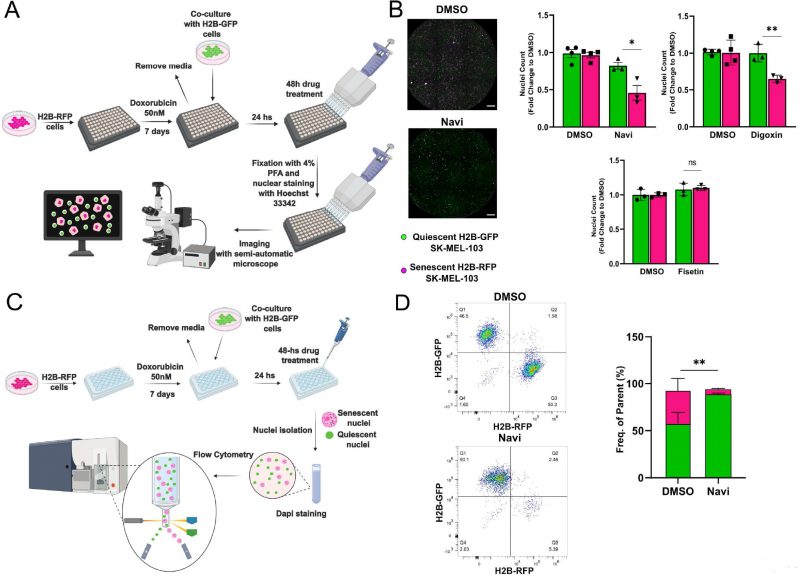
FIGURE 3: Validation of the senolytic assay in SK-MEL-103 cells. (A) Workflow of the fluorescence microscopy-based method used to detect senolytic effect of drugs. (B) Representative images (left panel) and count (right panel) of H2B-GFP versus H2B-RFP nuclei from H2B-GFP quiescent and H2B-RFP senescent (doxo-treated) SK-MEL-103 cells co-cultures incubated with vehicle (DMSO), navitoclax (Navi), digoxin or fisetin for 48 hours. Data (mean ±SD) are represented as Fold Change to DMSO. One representative experiment (N=3 independent experiments) is shown. (*p< 0.05; **p<0.01, two-tailed Student's t-test compared to senescent DMSO). Scale Bar 500 nm. (C) Workflow of the flow cytometryadapted method used to detect senolytic effect of drugs. (D) Representative density plot (left panel) and quantification (right panel) of H2BGFP and H2B-RFP nuclei isolated from H2B-GFP quiescent/H2B-RFP senescent (doxo-treated) SK-MEL-103 co-cultures, incubated with vehicle (DMSO) or Navi for 48 hours. Data are represented as mean ± SEM (pooled from N=3 independent experiments; **p<0.01, two-tailed Student's t-test compared to senescent DMSO).