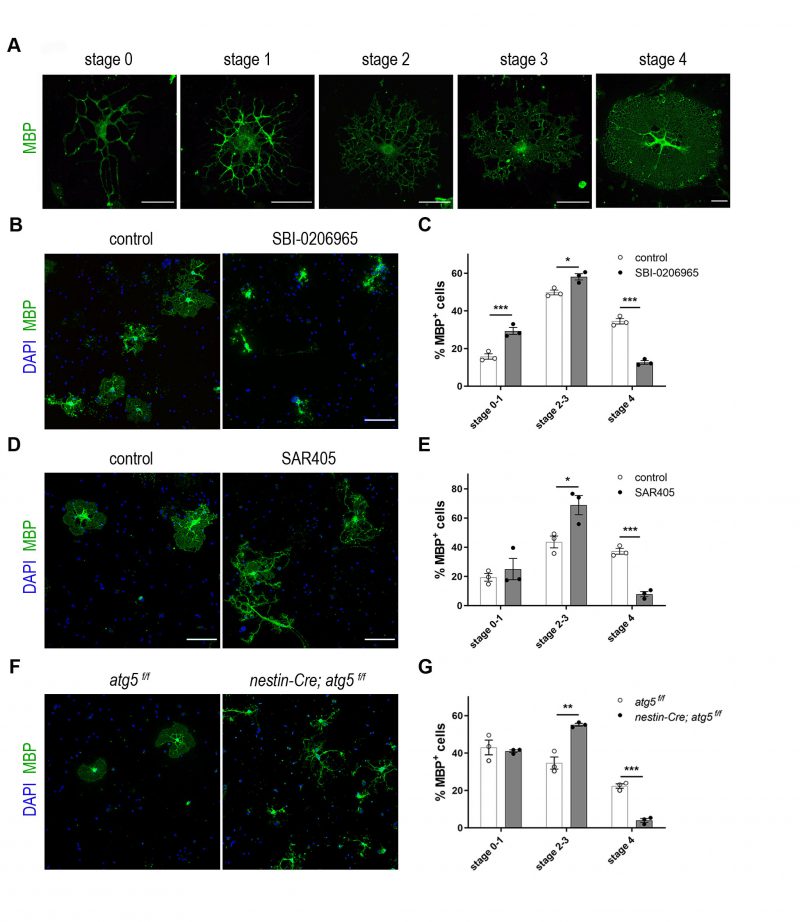
FIGURE 1: Pharmacological and genetic inhibition of autophagy results in maturation defects in oligodendrocytes. (A) Representative examples of mature DIV5 MBP-expressing OLs (MBP in green) that can be subdivided in five maturation stages. Scale bars: 30 μm. (B) Representative confocal images of DIV5 primary oligodendrocytes (OLs), immunolabeled for MBP (green) and DAPI (blue). Cells were either vehicle treated (control), or treated for 5 days with 1μM SBI-0206965. Scale bars: 100 μm. (C) Quantification of the percentage of the MBP+ OLs found in the stages described in the text. (D) Representative confocal images of cultured DIV5 primary oligodendrocytes (OLs), immunolabeled for MBP (green) and DAPI (blue). Cells were either vehicle treated (control), or treated for 5 days with 1μM SAR405. Scale bars: 100 μm. (E) Quantification of the percentage of the MBP+ OLs found in the categories described in the text. (F) Representative confocal images of DIV2 primary control (atg5 f/f) and cKO (nestin-Cre; atg5 f/f) OLs immunolabeled for MBP (green) and DAPI (blue). Scale bars: 100 μm. (G) Quantification of the percentage of the MBP+ OLs found in the categories described in the text. Data information: Data are shown as mean ± SEM. N=3 independent experiments per condition. An average of 170-200 cells per treatment per experiment were analyzed. For the quantification of OL complexity, Student's t-test was used to determine statistical significance between control and treated/cKO cells of each stage. *p < 0.05, **p ≤ 0.01, ***p ≤ 0.001.