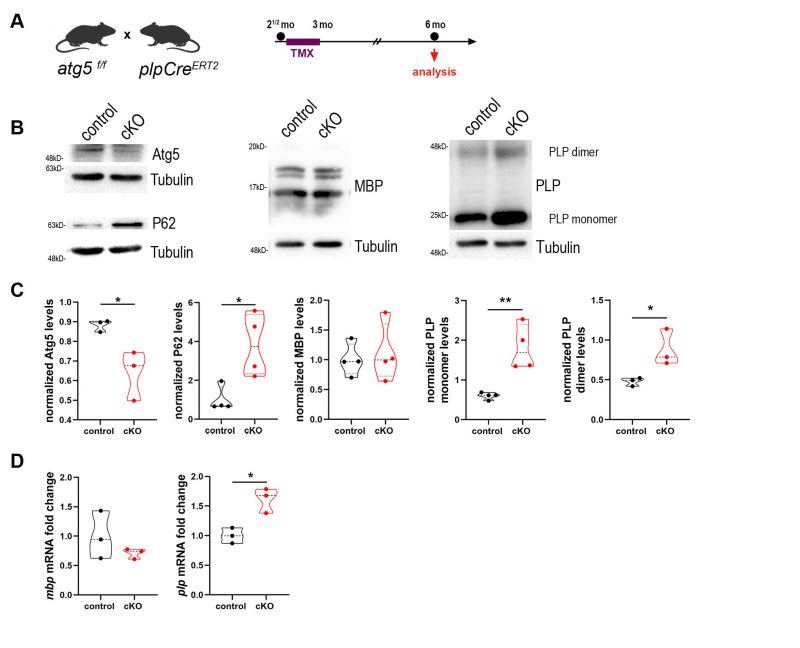
FIGURE 2: Blockage of autophagy leads to increased plp mRNA and protein levels. (A) Schematic illustration of the experimental protocol used for tamoxifen (TMX) induction and analysis in the plpCreERT2; atg5 f/f mice. All animals were injected i.p. with 1 mg of TMX per day at the age of 2.5 months for 10 days with two days break in between. The analysis was performed at 6 mo. (B) Western blot analysis with antibodies against Atg5, P62, PLP and MBP proteins in optic nerve lysates of 6mo control and cKO mice. Representative images of a single experiment are depicted. (C) Quantification of normalized protein levels of “B”. (D) Quantification of quantitative real-time PCR in mouse optic nerves of 6mo control and cKO mice. Data information: Data are shown as mean ± SEM. N=3-4 animals per genotype. Student's t-test was used to determine statistical significance between control and cKO protein and mRNA levels. *p < 0.05, **p ≤ 0.01.