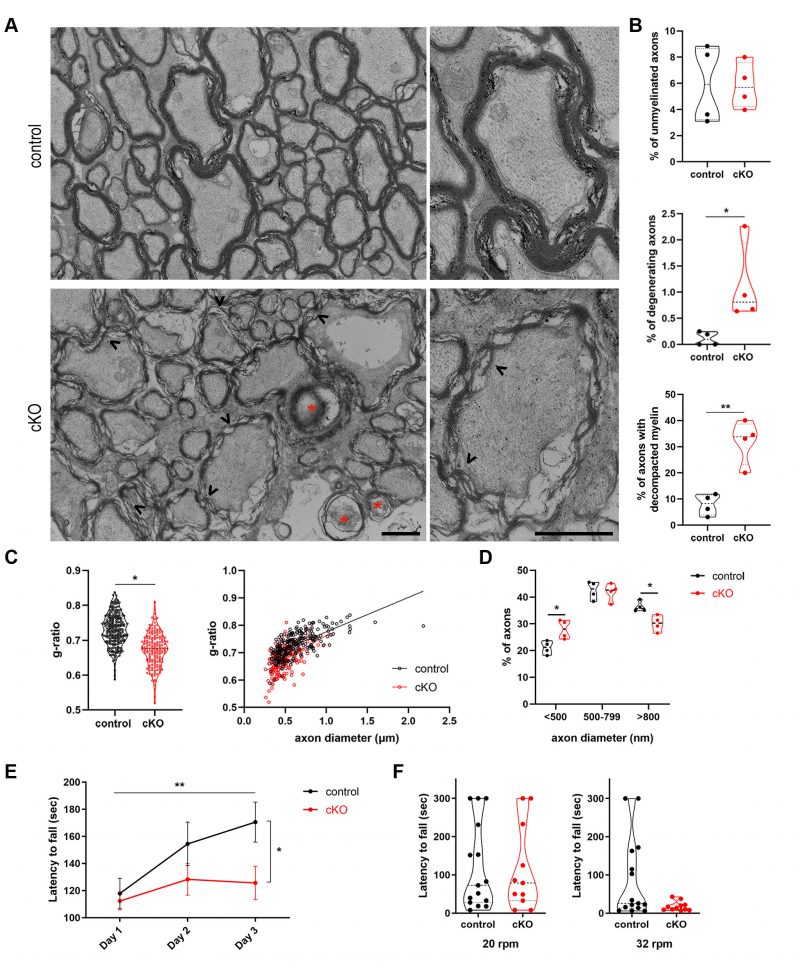
FIGURE 5: Autophagy in OLs is an essential mechanism for the maintenance of CNS myelin. (A) Ultrastructural analysis of optic nerves from plpCreERT2-; atg5 f/f (control) and plpCreERT2+; atg5 f/f (cKO) mice. Representative electron micrographs of cross sections of control and cKO optic nerves, demonstrating the presence of degenerating axons (indicated by red stars), decompacted myelin sheaths (arrowheads) and unmyelinated axons (arrows). (B) Quantification of axonal degeneration, decompacted myelin sheaths and unmyelinated axons in control and cKO mice. Violin plots presenting individual values (450-500 axons measured for each mouse, student's t-test. N= 4 animals per genotype). (C) Myelin sheath thickness was assessed using g-ratio measurement of EM images from control and cKO animals. Plot of g-ratio values per animal group (each point represents an axon) and g-ratio distribution to different axonal diameters of the two groups (linear regression, 260 measured for the control, 170 axons for the cKO group and n= 4 animals per genotype). Scale bar: 1 μm. (D) Quantitation of the percentage of axons with small (<500nm), medium (500-799nm) and large (>800nm) caliber in control and cKO optic nerves. (250 axons measured for each mouse, student's t-test. N= 4 animals per genotype. *p < 0.05, **p ≤ 0.01. (E) Performance of mice in the rotarod task. Line graph showing latency to fall during training (3 days). N= 15 for control; n=11 for cKO. Two-way ANOVA (Tukey's multiple comparisons test) was used to determine statistical significance. For controls: Day 1 vs. Day 2, p=0.954; Day 2 vs. Day 3, p=0.6255; Day 1 vs. Day 3, p= 0.0093. For cKOs: Day 1 vs. Day 2, p=0.7105; Day 2 vs. Day 3, p=0.9907; Day 1 vs. Day 3, p= 0.7875. For day 3 (control vs cKO), p=0.0362. *p < 0.05, **p ≤ 0.01. (F) Violin plots showing latency to fall during the testing phase in the rotarod task. Control, n= 15; cKO, n=11. Student's t-test was used to determine statistical significance. At Day 4(20 rpm), p>0.9999; at Day 5(32 rpm), p= 0.1052. Data information: Bar graphs depict mean ± SEM.