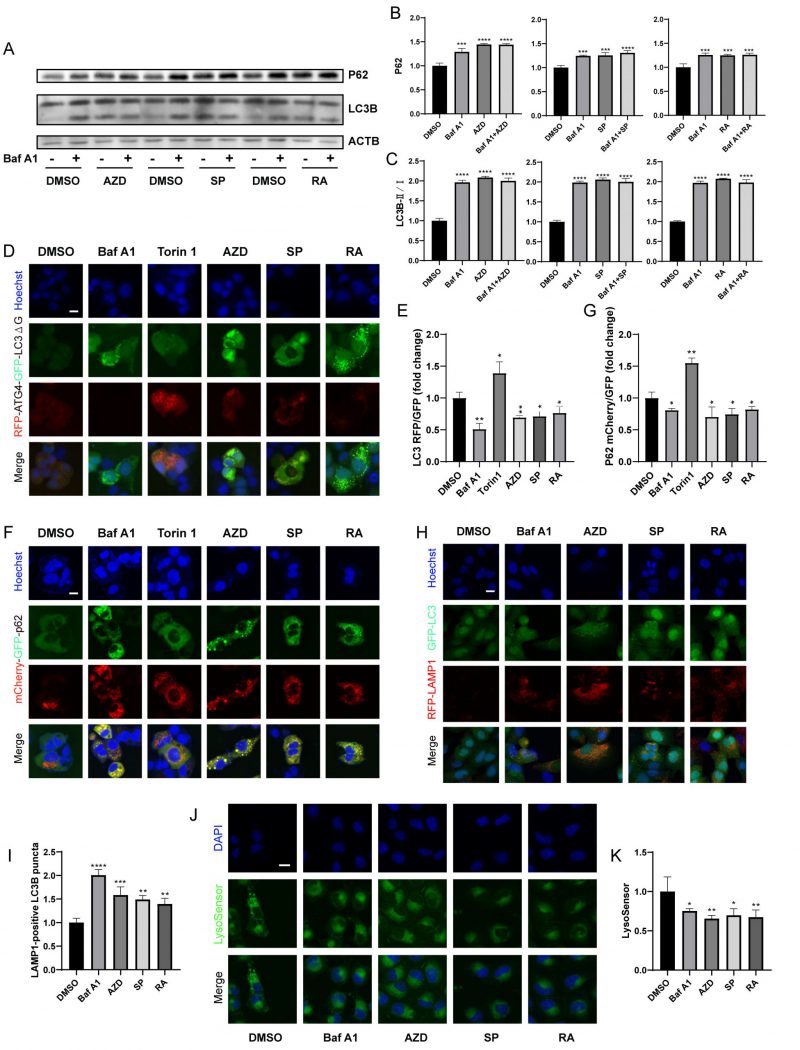
FIGURE 3: Macrolide antibiotics block the autophagy flux. (A) U2OS cells were treated with AZD (40 µM), RA (40 µM) or SP (40 µM) combined or not with Baf A1 (10 nM) for 4 h. Then the western blot was conducted. And the relative expression of P62 and LC3B II/I was calculated (B, C). (D, E) GFP-ATG4-RFP-LC3BΔG-expression and (F, G) mCherry-GFP-p62-expression U2OS cells were treated with Torin 1 (300 nM), Baf A1, AZD, RA or SP for 6 h. The fluorescence of GFP and RFP was measured, and the RFP/GFP ratio was calculated (E, G). (H, I) GFP-LC3 and RFP-LAMP1 U2OS cells were treated with Baf A1, AZD, RA and SP for 6 h. And the LAMP1-positive LC3B puncta were measured (I). (J, K) U2OS cells were treated with Baf A1, AZD, RA and SP for 6 h, and incubated with LysoSensor for 30 min at 37°C. Then the average intensity of lysoSensor fluorescence was assessed (K). Representative images are presented (J). Scale bars equal 10 μm. *P<0.05; **P < 0.01; ***P < 0.001; **** P < 0.0001 compared with DMSO.