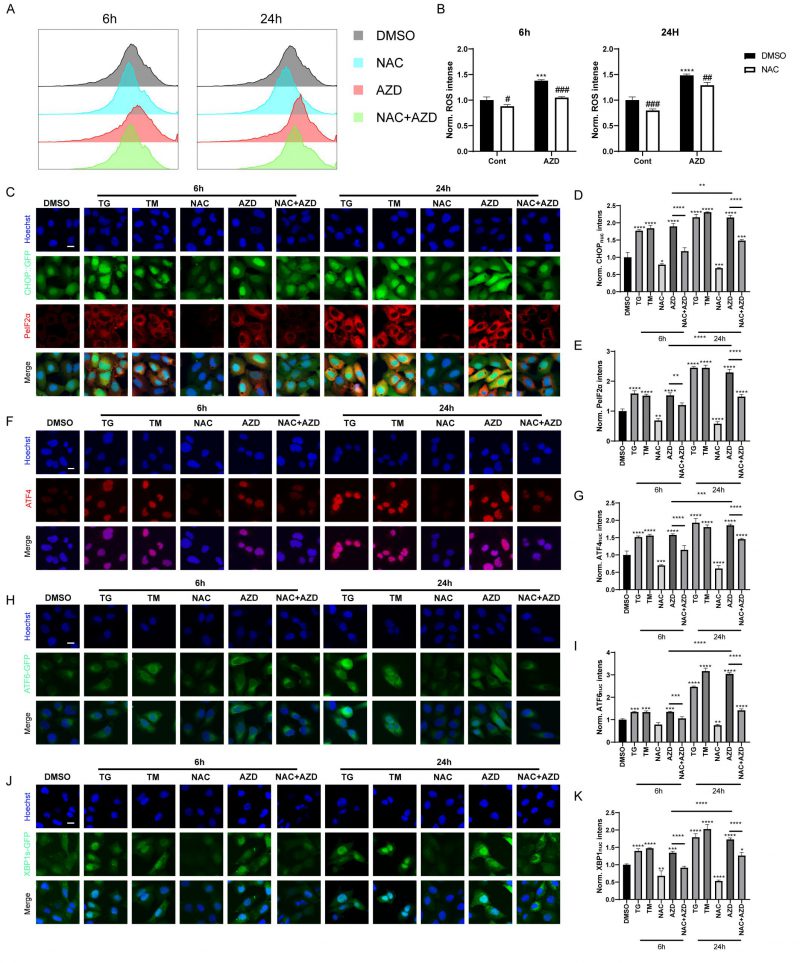
FIGURE 4: AZD induces ROS accumulation and ER stress. (A, B) ROS generation was detected by DCFH-DA probe. MCA205 cells were treated with AZD (40 µM) combined or not with NAC (3 mM) for 6 h or 24 h. Fluorescence intensity histogram (A) and average fluorescence intensity (B) are presented. (C-E) CHOP::GFP-expression U2OS cells were treated with TM (3 μM), TG (3 μM), AZD, NAC or NAC combined AZD for 6 h or 24 h, and PeIF2α was assessed by immunostaining. Representative images are presented (C). The intensity of fluorescence was measured (D, E); (F-K) wild type, ATF6-GFP-expression and XBP1s-ΔDBD-venus-expression U2OS cells were treated with TM, TG, AZD, NAC or NAC combined AZD for 6 h or 24 h, then ATF4 was assessed by immunostaining, ATF6 and XBP1s was assessed by GFP intensities. Representative images of ATF4 (F), ATF6 (H) and XBP1s (J) nuclear translocation are presented. The average nuclear intensity of ATF4 (G), ATF6 (I) and XBP1s (K) was assessed. Scale bars equal 10 μm. *P<0.05; **P < 0.01; ***P < 0.001; **** P < 0.0001 compared with DMSO. And the horizontal line indicates the comparison between the two groups.