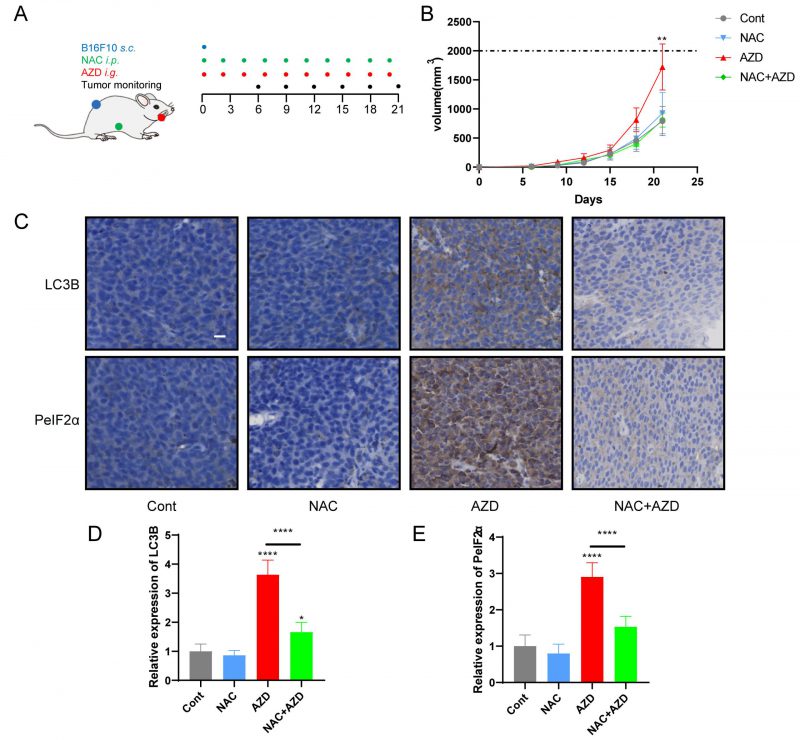
FIGURE 6: NAC reverse AZD-induced tumor growth stimulation. (A-C) In vivo treatment of implanted murine B16F10 melanoma with AZD combined or not with NAC (schematic view in A). (B, C) The data of administration of AZD combined or not with NAC, depicted as (C) growth curves (mean±SD). (D-F) Immunohistochemical analysis was performed on paraffin-embedded sections of B16F10 melanoma tissue in mice by using LC3B and eIF2α. Representative images are presented (D) and the staining score was assessed (E, F). Scale bars equal 20 μm. *P<0.05; **P < 0.01; ***P < 0.001; **** P < 0.0001 compared with Cont. And the horizontal line indicates the comparison between the two groups.